
Heatmaps
See where in your world an event happens: deaths, purchases, joins or any marker you send with a position, drawn over a top-down image of your map.
A heatmap shows where in your world something happens. Pick an event, such as PlayerDied, and Gamebeast counts where it was sent from and draws the hotspots over a top-down image of the area, so you can see the choke point where players die, the chest nobody finds, or the corner of the map nobody visits.
Any marker sent with a position can be drawn on a heatmap, so once your experience sends positions you can map any event for any period you have data for.
Heatmaps and heatmap queries
There are two parts, made in two places:
- A heatmap is the map: a rectangular region of your world between two corners, point A and point B, and a top-down image of it. You make it in your game engine with the Studio plugin (or the Godot dock).
- A heatmap query is a chart: where one event happened on a heatmap, over a time range and with optional filters. You build it in the query builder and save it to a dashboard like any other query.
One heatmap can be used by many queries: deaths, chest opens and joins on the same arena, for example.
Sending positions
A heatmap reads the position property of a marker: an [x, y, z] world position. Send it with the marker:
- Roblox: pass a
Vector3as the last argument of:SendMarkeror:SendPlayerMarker, such as the character'sPrimaryPart.Position. - Godot: use
send_position. AVector2from a 2D game is sent on the heatmap's plane. - Unreal: add an
FVectorproperty namedposition; see Markers.
Positions are read on the horizontal plane: x and z place the point, and the height (y) is ignored, so deaths on a bridge and in the river under it land in the same spot. Positions outside the region between point A and point B aren't counted.
Making a heatmap in Roblox Studio
Open the Gamebeast plugin in Roblox Studio and go to the Heatmap tab. It asks for an API key with the heatmap permissions, which you can create in the dashboard.
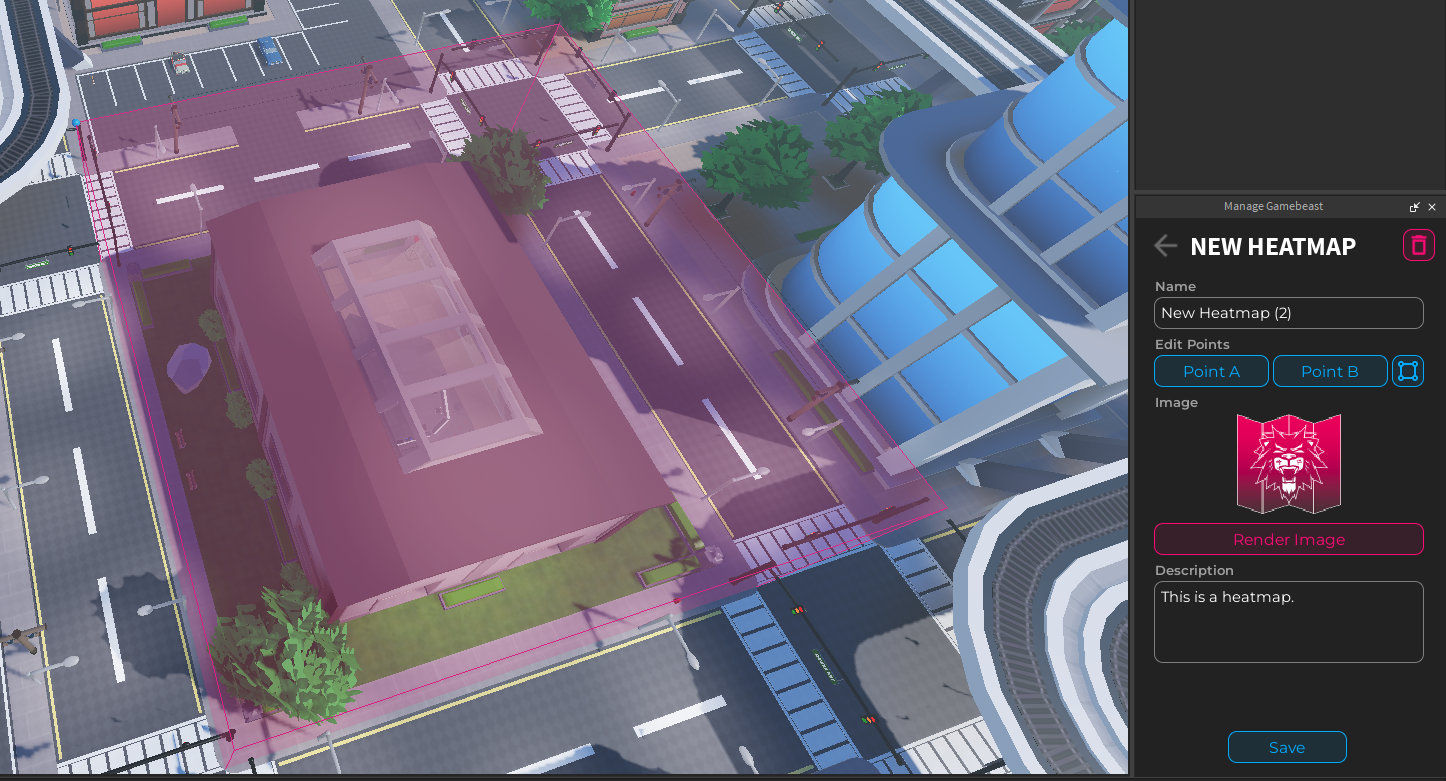
Click Create Heatmap to make one, or pick one from the list to edit it. The trash icon deletes it.
| Option | What it does |
|---|---|
| Name | How the heatmap is listed in the dashboard's map picker. |
| Edit Points | The two corners of the region. A or B selects that corner and moves the camera to it so you can drag it. The square button sets both corners to the bounds of whatever you have selected in the workspace. |
| Image | A preview of the top-down image. Render Image renders the region again, which takes 10 to 20 seconds depending on its size and your computer. |
| Description | A note for your team, such as which area the heatmap covers. |
Keep the region to the area you care about. The image is rendered at a fixed scale, so a whole-world heatmap of a large place gives a small, blurry map of each area.
In Godot, the Gamebeast dock does the same; see Heatmaps in the Godot SDK.
Creating a heatmap query
Open a dashboard, click Edit, then Add panel → Query, and select Heatmap from the query types at the top of the query setup.
- Pick the map. The map picker shows each heatmap's image and name.
- Pick the event, under Metric: the marker whose positions are drawn. A heatmap query has one event.
- Choose how to measure it. Total Events by default. The other measurements work too, such as Total Sessions to count sessions instead of events.
- Filter it, if you need to, with Global Filters: only deaths in round 3, only mobile players, only new players.
Heatmap queries don't have breakdowns. To compare two groups, such as mobile and PC, save one query for each and put them side by side on a dashboard.
Reading the heatmap
Gamebeast cuts the region into a grid and counts the event in each cell, then draws the counts as smooth contours over the map: purple and blue where there's a little, green and yellow where there's more, and red at the hotspots.
- Hover the map to read the count there. The number is an estimate from the smoothed contours, so it's shown as ≤: no single spot in that area is higher.
- Drag to pan and scroll (or pinch) to zoom, up to 20 times.
- The legend under the map shows the range of counts the colours cover.
Each cell of the grid is 5 pixels of the map image across. Zooming in further than that doesn't show more detail.
Display settings
The legend's controls change how the map is drawn, not what's counted. They aren't saved with the query, and reset when you reload.
| Control | What it does |
|---|---|
| Colour range | Drag the handles on the legend to spread the colours over part of the range. Raise the low end to hide the faint background and keep only real hotspots. Lower the high end to tell apart the busy areas when one spot is far hotter than the rest. |
| Size | How far each count spreads. Smaller shows sharper, more separate spots; larger shows broad areas. Shows "Limited by the resolution of the data" when it can't go smaller. |
| Opacity | How much of the map shows through the contours. |
| Scale to view | Re-draws the colours for the part of the map on screen each time you stop panning or zooming, so a quiet area you zoom into gets the whole colour range. |
| Rotation | Turns the map a quarter turn at a time. The map is turned to fit the chart automatically to start with. |
Size, Opacity, Scale to view and Rotation are under the ⋮ on the legend. Click the arrow beside the legend's title to widen it for finer control of the range, and Reset to put everything back. To reverse the colours, turn on Invert colors order in the query's options.
When you've lowered the high end of the range, every area above it is drawn the same colour, so hovering one shows ≥: the real count is at least that.
Managing heatmaps
The Heatmaps tab of the Data page lists every heatmap in the project. From a heatmap's menu you can:
- Preview heatmap to see its image.
- Edit heatmap to change its name or description.
- Delete heatmap. This breaks every query that uses it, so check your dashboards first.
To move the region or render a new image, use the Studio plugin.
Saving and dashboards
Save a heatmap query like any other; see Saving a query. On a dashboard it refreshes with the dashboard, and you can pan, zoom and change the display settings there too.
Heatmaps can't be exported from the dashboard. To pull the counts into your own tools, use the API.
Tips
- Send positions on the markers you'll want to map from the start. A heatmap can only draw markers that were sent with a position.
- Make one heatmap per area that matters, such as each arena, instead of one for the whole world.
- Height is ignored, so floors of a building land on the same spot. Send the floor as a property and filter by it.
- If one spot is so hot that everything else looks empty, lower the high end of the colour range.
- To see where players spend their time, not just where they do one thing, send a periodic position marker and map that.
With the assistant
Ask the assistant things like "where do new players die on the arena?" or "which chests do players open most?". It builds the heatmap query, draws it over your map in the chat, and looks at the map image so it can tell you where the hotspots are by place ("most deaths are on the bridge") rather than by coordinates. It can open the chart in the query builder or add it to a dashboard, and each change waits for your approval.
Agents connected over MCP can do the same: list_heatmaps finds your maps, get_heatmap_image shows them a map, and run_heatmap_query returns the busiest spots. Neither the assistant nor agents can create or move heatmaps themselves: those always come from the Studio plugin or the Godot dock.
With the API
Run a heatmap query from your own tools with Execute heatmap query. It returns the count in each grid cell, with the heatmap's bounds and grid size so you can place them. The SDK's heatmap endpoints create, list and update heatmaps and upload their images.
Retention
Measure how many players come back after doing something: day 1, day 7 and day 30 retention, the retention curve, and a cohort grid.
Formulas
Combine metrics with arithmetic to chart ratios, rates and per-player values: conversion rates, revenue per user, stickiness. Give a formula its own metrics to make it portable, then save it and reuse it in any query.